Profitable Day Trading Strategies With A Top Down Approach
With the day trading strategies presented in this article, you will have a reliable and permanent edge over the market in your trading arsenal. The strategies combine multiple edges and logical trading concepts into one big edge. And the best part is that you will have very accurate entry signals with the help of a FREE Double Top/Bottom indicator.
The FREE indicator detects the so-called “Double Tops/Bottoms with Fake Breakouts”. The following diagrams show the reversal patterns that the smart money uses to reverse the direction of the trend:

The indicator works because all financial markets are driven by the smart money in the same way.
The double top/bottom indicator exploits the never ending cycle of how the smart money works:
1. Accumulation
2. Trapping
3. Trend Reversal
You can combine this indicator with a visual analysis of the bigger picture and then only trade the signals which occur in direction of the bigger picture.
Day Trading Strategies with The FREE Indicator
We will now have a detailed look at some day trading strategies that combine multiple edges into one big edge. For this purpose you can use a top down approach, whereby you trade the signals on lower timeframes only in direction of the analysis of the bigger picture.
One possible top down approach is to draw trend lines on, for instance, the D1/H4 timeframes and then use the signals on H1/M30/M15 and M5 only in direction of the trend line, and only those signals that occur directly at or near the trend line.
Double Tops/Bottoms Directly at A Trend Line
Double tops and bottoms that occur directly at a trend line are one of the best setups that you can trade. Often enough the price gets rejected immediately from the trend line and then the trend continues. But if you get a double top or bottom directly at the trend line, then the edge you get is even that much greater. In such a scenario, you get a very early confirmation that the next move phase of the trend has started. The profit potential of such signals is huge because there is a lot of room for a big subsequent move.
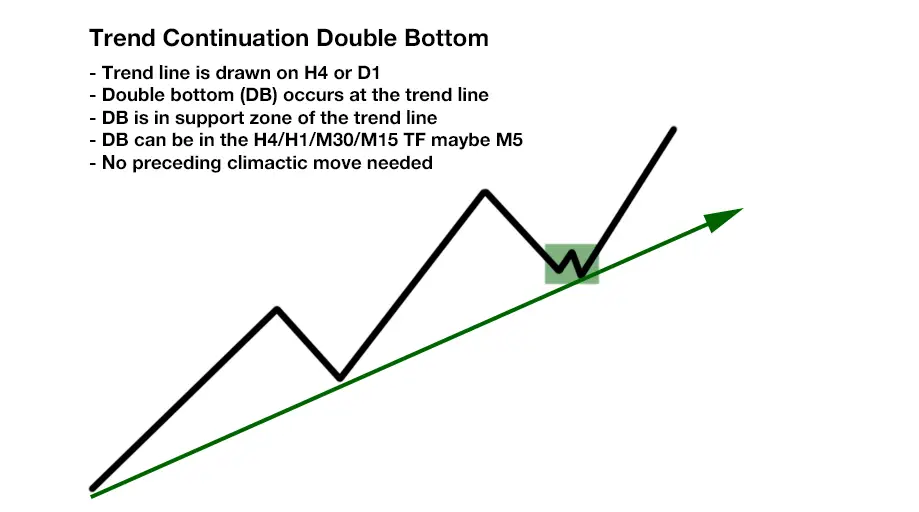
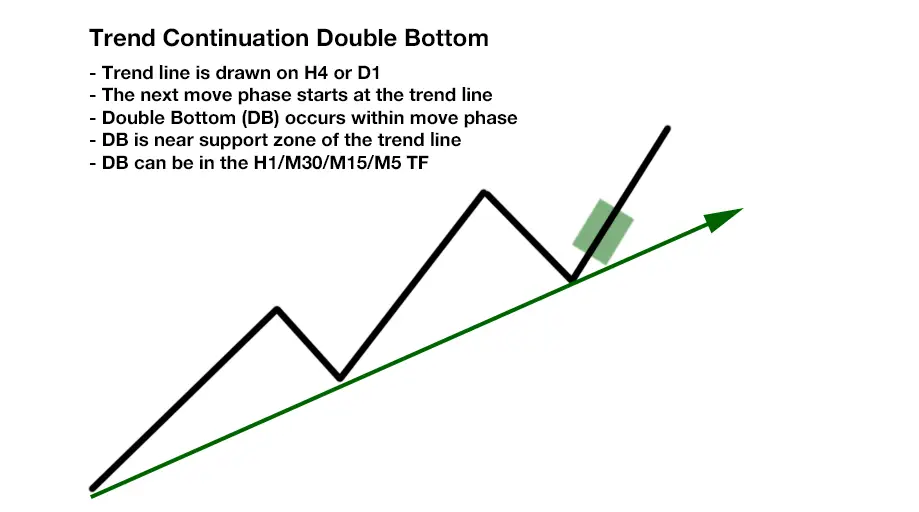
The following diagram shows a double bottom directly at the trend line:
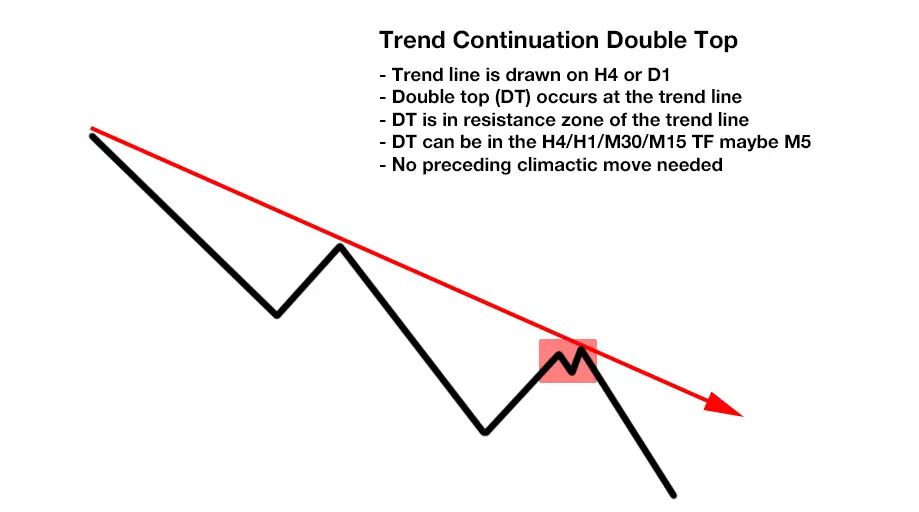
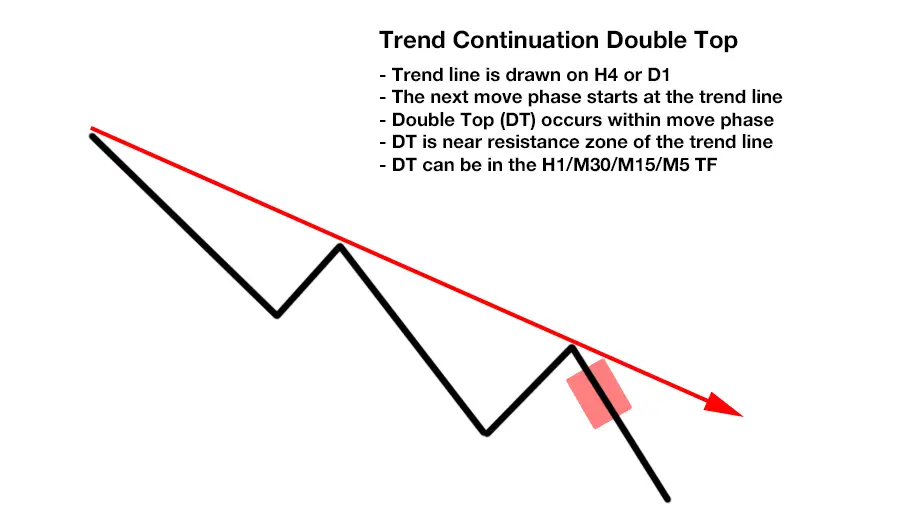
The following diagram shows a double top directly at the trend line:
A Real Chart Example
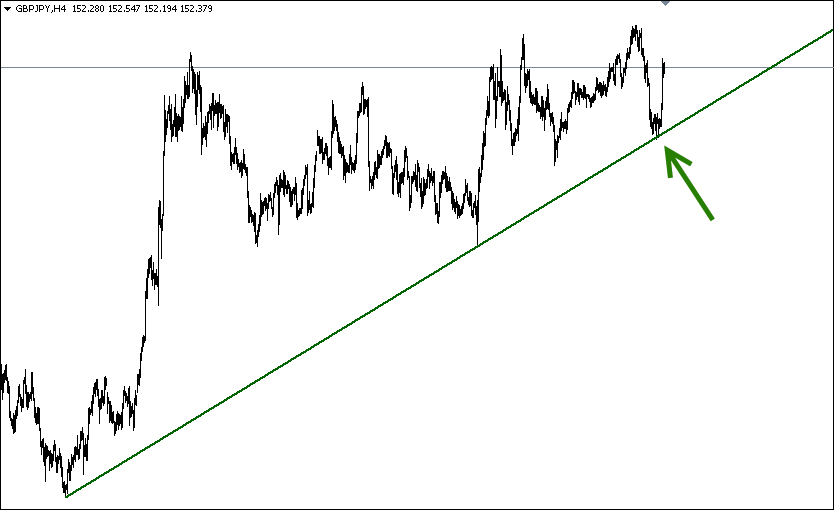
The following screenshot shows a rising trend line drawn on the H4 timeframe. At the point where price touches the trend line, labeled with the green arrow, a double bottom entry signal has occurred on a lower timeframe.
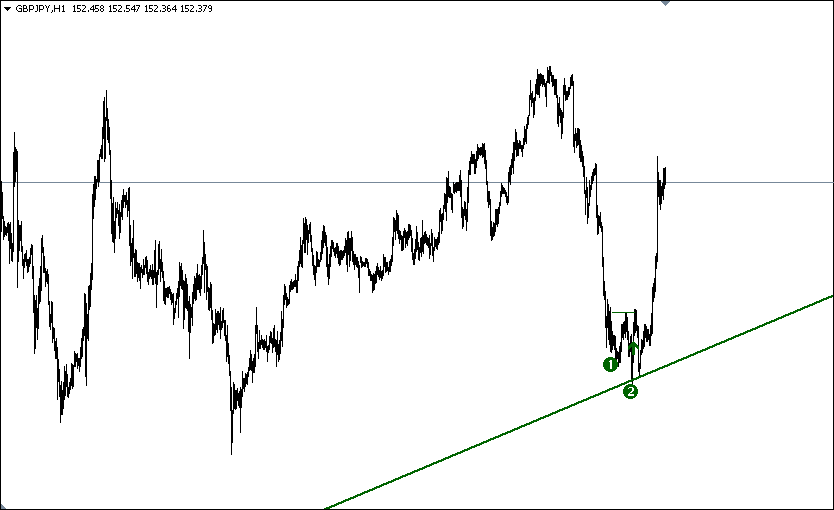
The next screenshot shows the entry signal that occurred on the H1 timeframe directly at the trend line:
Double Tops/Bottoms Near A Trend Line
Double tops and bottoms that occur near a trend line after the move phase has begun are also extremely good setups. The price has touched or come near a trend line drawn on D1 or H4. Then the next move phase in direction of the trend started. The beginning of the move phase can be visualized, for instance, with the Heiken Ashi indicator on the H4 timeframe. After the Heikin Ashi has confirmed the next move phase, you would then wait for a double top/bottom signal on a lower timeframe, M5 to H1, in the direction of the trend line. These signals will have great profit potential because the next resistance/support area is usually far away and the underlying trend will carry the winning trades far away.
For a double bottom you can use following rules:
The price gets rejected from the trend line to the upside. With the Heiken Ashi of the H4 timeframe having turned green, it’s an indication that the price has moved in the direction of the trend. With the Heiken Ashi now showing green value, you shall lookout for double bottom signals on H1, M30, M15 and M5.
For a double top you can use following rules:
The price gets rejected from the trend line to the downside. With the Heiken Ashi of the H4 timeframe having turned red, it’s an indication that the price has moved in the direction of the trend. Withthe Heiken Ashi now showing red value, you shall wait for double top signals on H1, M30, M15 and M5.
A Real Chart Example
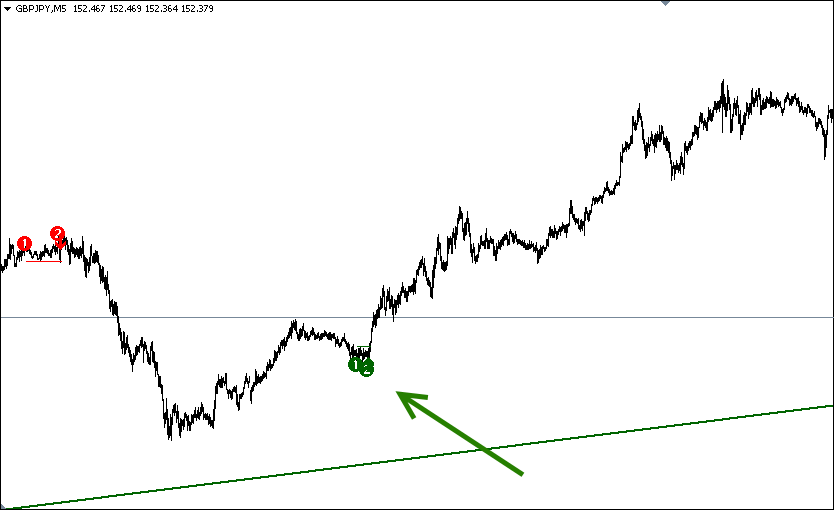
The following screenshot shows rising trend line on the H4 timeframe. The price came close to the trend line and was then rejected to the upside. During the move phase, in the area labeled with green arrow, a double bottom entry signal has occurred on the M5 timeframe.
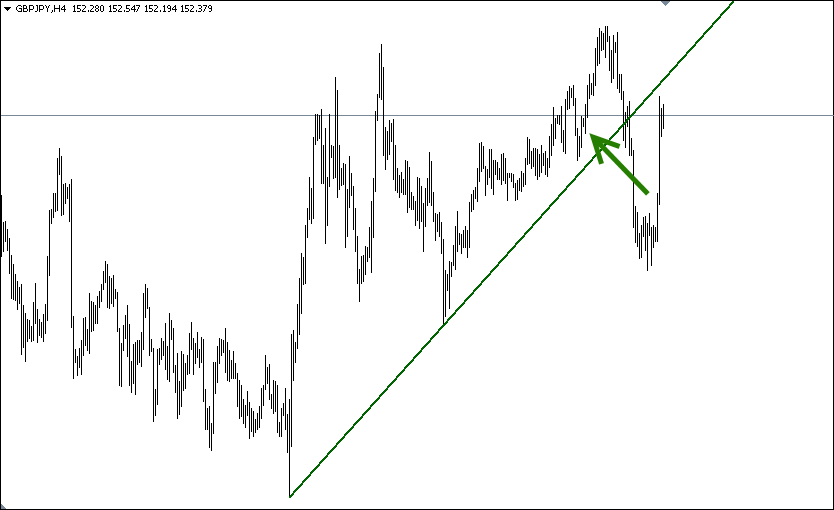
The following screenshot shows the entry signal on the timeframe M5:
